Pattern recognition from any image
Screenshots, photos of a monitor, charts from any broker or exchange. The model recognises the key formations traders rely on and marks them for you.
Take a photo or screenshot of any stock or crypto chart. Chart AI finds the pattern in seconds and tells you what it usually means: time to enter, time to wait, or time to get ready to exit.
No drawing tools, no indicator settings. Point your camera at the chart and let the model do the reading.
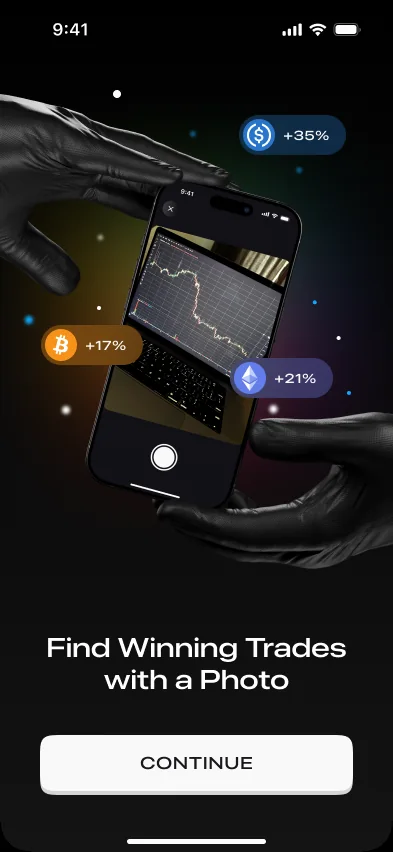
Upload a screenshot from any trading platform, or take a photo of your monitor. Candles, line charts, any timeframe.
The model reads the candles, locates swing highs and lows, and draws the trendlines a technical analyst would.
You see which formation it found, what that pattern usually leads to, and a plain suggestion: consider entering, hold off, or prepare to exit.
Use the analysis as one input next to your own research, position size and risk rules. The final call stays yours.
Classic formations used by traders around the world, from reversals to continuations. Pick one to see how Chart AI marks it up.
Three peaks with the middle one highest. When price closes under the neckline that joins the two dips, the uptrend is often over.
Prepare to exit or tighten stops once the neckline breaks.
Price hits the same ceiling twice and fails both times. Losing the low between the peaks confirms buyers are running out of steam.
Prepare to exit. Opening a new long here is premature.
Two tests of the same floor, then a push through the high between them. A classic sign that sellers are exhausted.
Consider entering on the breakout, with a stop below the two lows.
A flat ceiling with rising lows underneath. Buyers step in higher each time until resistance gives way.
Consider entering on a confirmed close above resistance.
A sharp rally, then a tight channel drifting slightly lower. The pause often comes before another leg up.
Consider entering when price breaks the top of the flag.
Lower highs and higher lows squeeze price into a point. Neither side is in control until the breakout.
Hold off until price breaks out of the triangle, then follow the direction.
Everything the app does is built around one job: turning a picture of a chart into an answer you can act on.
Screenshots, photos of a monitor, charts from any broker or exchange. The model recognises the key formations traders rely on and marks them for you.
Equities or digital assets, the same photo-to-signal flow works across chart types and platforms.
Practical suggestions based on the detected pattern, without a wall of indicators.
Skip annotating trendlines by hand or second-guessing what you see. Snap the chart and the AI does the tracing.
Learning technical analysis? See each pattern named and explained. Trading daily? Get a second opinion in seconds. Built for day traders, swing traders and beginners alike.
A clean, dark interface built for quick checks between trades.
LaunchOpens straight into the app, dark by design.
Snap a chartPoint the camera at any chart or pick a screenshot.
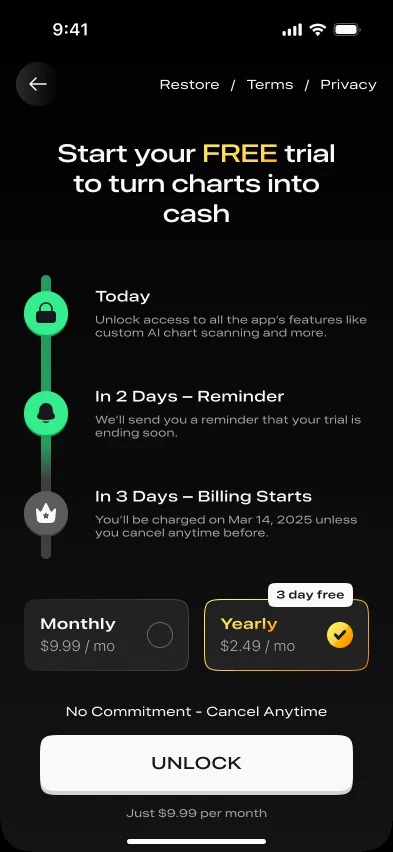
Try it freeA free trial with a clear timeline of what happens when.
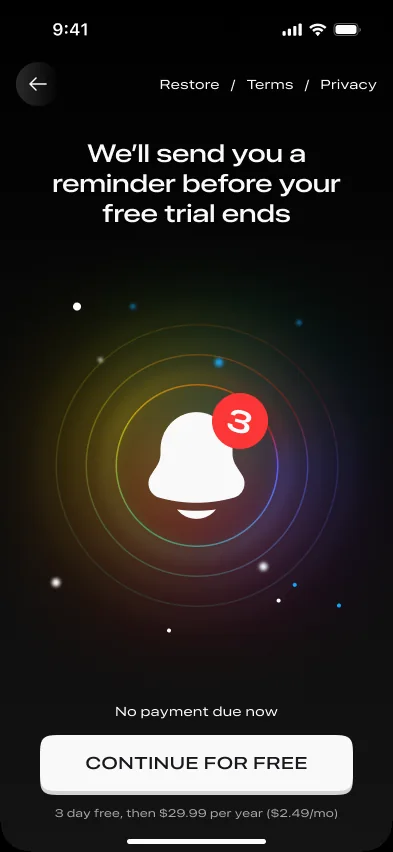
No surprise chargesYou get a reminder before the trial ends.
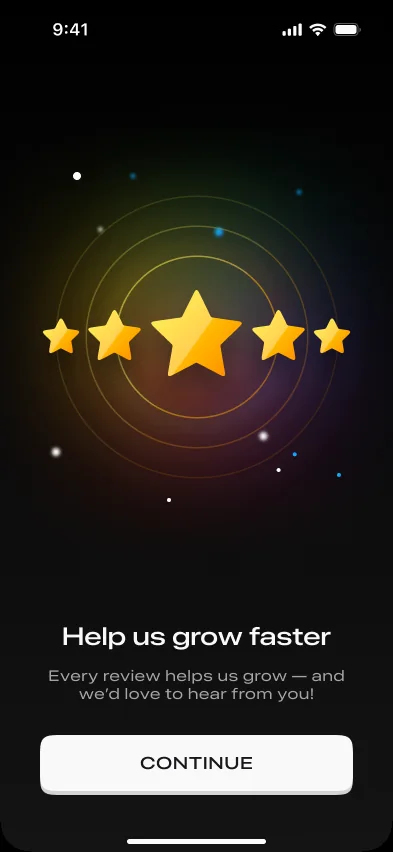
Shaped by tradersYour reviews decide what we build next.
Can't find what you need? Write to [email protected].
No. The app reports technical chart patterns detected by AI and what those patterns typically suggest. It doesn't know your goals or risk tolerance and doesn't guarantee accuracy or profit. Always do your own research and talk to a licensed financial adviser before investing.
Stocks and crypto. It reads charts from a wide range of platforms, so you can use screenshots from your broker, an exchange or a charting site.
Yes. Take a picture of the chart with your iPhone camera or upload an image from your library. For the best result, keep the whole price area in frame and avoid strong glare.
Classic formations such as head and shoulders, double tops and bottoms, triangles and flags, among others. Each result names the pattern and explains what it usually signals.
Yes. You can start with a free trial, and the app sends a reminder before it ends so you can decide whether to continue. Current plans and prices are shown in the app before you subscribe, and you can cancel any time in your App Store settings.
Basic usage and device information such as IP address, the screens you visit and your operating system. It does not collect your precise location. Full details are in the privacy policy.
Email [email protected] or use the form on the contacts page. We reply within 24 hours on business days, Monday to Friday, 9:00–18:00 (GMT+4).

React faster, analyse better and trade with more confidence. Download Chart AI for iPhone.